~ L E V E L 6 ~
Overview of Your Management Steps
Step 2 of 3
The information below is better understood if you’ve read Levels 1 – 4
and have an understanding of averaging, dedicated bank accounts
and knowledge of the problem we’re solving ~ variability.

Can you “see” the forest through the trees inside your BLUE account?

Take a moment to review and understand the math that’s taking place inside your BLUE account – it’s your most important account?
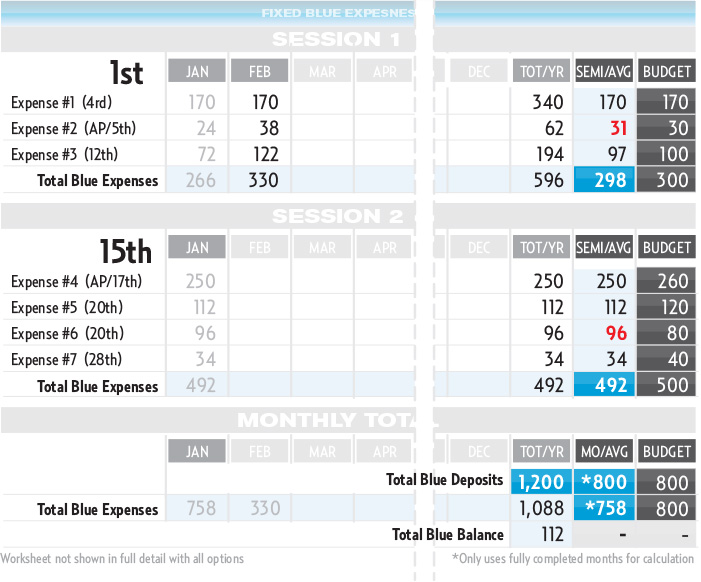
If you look, you’ll see your Total Blue Deposits of $1,200 at the bottom right of this worksheet. This figure was taken from your Income & Deposit Worksheet you just completed (3 Session deposits of $400 each equals $1,200).
Under that you’ll see your Total Blue Expenses totaling $1,088 for the year for the same 3 Sessions. This figure was calculated from the figures you see on this BLUE worksheet. This reveals a balance of $112 in your BLUE account. That means, despite your expense variablity, you’re depositing more than you’re spending – and so you’re in good shape.
~~~~
Note that while you may repeat the same process of depositing, paying and tracking at each session, there are actually two different groups of expenses that are due in each session during this Step, and they’re sorted in order by due date as you see above.
Note that Session 1 has a Total Budget Expense figure of $300 and Session 2 has a Total Budget Expense figure of $500. Though different, it makes no difference to you, because if you recall in Step 1, you deposit THE SAME “AVERAGE” AMOUNT at each session of $400 to your BLUE account.
Both instances total $800/month. You’re letting your BLUE account hold the excess balance from Session 1 for the higher expenses in Session 2 and AUTOMATICALLY letting your BLUE account absorb the temporary expense variability – so there’s no reason to change a single calculation ~ or your lifestyle.
~~~~
Also note that Expense #2 above is a variable expense, and MoneySlinger has calculated an ACTUAL monthly average that is greater than your BUDGET average, turning it red. Now remember these are not balance figures – but average figures. So a figure of $31 vs $30 means you’re averaging $1 MORE PER MONTH than your average BUDGET figure – so you’ve essentially paid out $2 more this year in total than you estimated for this one expense.
Problem? Not at all.
Remember you’re not managing
individual trees anymore
– but the forest.
Note Expense #3 above is also a variable expense, and you’re averaging $3/month BELOW your BUDGET figure, and so when you add and average all your trees together in Session 1, you can “see” the forest through the trees, and see you’re ACTUAL AVERAGE is $2/month LESS ($298) than your estimated BUDGET AVERAGE of $300/month for Session 1.
MoneySlinger takes this simple, mathematical logic and not only applies it to Session 2, but then compounds this very same mathematical effect by totaling and averaging Sessions 1 & 2 together, resulting in a complete month’s financial activity. The very same same process repeats itself all year long.
So what’s happening inside your BLUE account?
Instead of spending all your time and energy chasing variability in order to sew together some type of temporary order – and then patting yourself on the back for doing a great job, MoneySlinger is using variability against itself – neutralizing variability, and eliminating the time and energy needed to manage it. Instead of fighting variability, you’re “letting it happen” inside your BLUE account while you oversee the forest using a SINGLE MASTER FIGURE.