~ L E V E L 1 ~
Finding the Forest In the Trees
1. Typical Money Management

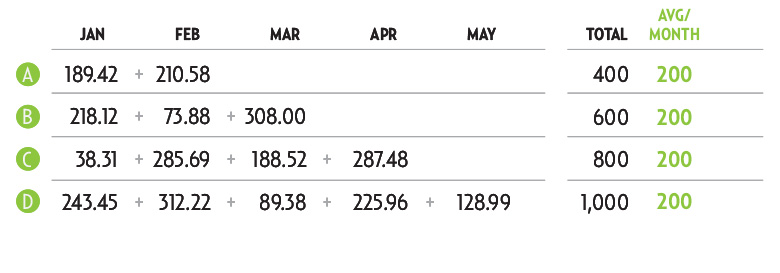
The table above illustrates what you might typically be doing when tracking your expenses using a traditional money management application over a few month’s time. Each row represents a different expense you may be tracking.
Note the amount of variability. Not only are the figures themselves extremely variable, but they’re extremely detailed, where hundreds of dollars are counted to the smallest fraction of a single dollar ~ or to the penny.
Note the total figures in the far right column will vary as well with every additional entry you make (they total whole figures for sake of easy demonstration).
If you’re striving for financial control by traditional budgeting objectives, you’re trying to meet individual monthly budget figures for each item ~ each month. You have only to succeed or fail each month for each item individually, and then attempt to stay within your budget again the next month for each item all year long.
Where the extra money comes from when you’re over budget, and where the extra money goes when you’re under budget is beyond the traditional budgeting means. This is traditional money management, using only elementary addition and subtraction in your calculations.
2. MoneySlinger’s “Running Averages”

However, if you were using MoneySlinger to “manage your cashflow”, you could see far more then an eye full of individual, complex and highly variable figures in this table of data. You would begin to see the forest through the trees.
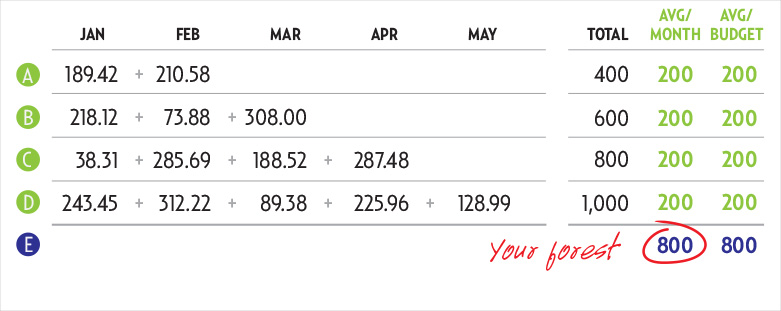
Using the very same figures, but then taking an extra step to calculate a “running average” for each item, you can see that despite what seems like a dizzying array of extremely variable figures, you’re actually AVERAGING the EXACT SAME AMOUNT EACH MONTH for EACH ITEM.
The point is not that each item is
averaging the same amount, but how
“THE SAME” ~ even to this exactness, was
invisible a moment ago. This is the hidden
wisdom found in the power of averaging.
To find an average figure you simply take the total expense for each item and divide by the number of figures that contributed to that total.
3. Managing Your Running Averages
But MoneySlinger does more. While it calculates your ACTUAL average expense each month as you progress through the year (that’s why it’s called running), it allows you to compare it to your monthly BUDGETED average you estimated at the beginning of the year seen in the far right column. What’s so different about that?
For starters, it must be understood that
an “average figure” is not a “balance figure”,
which is what you’re used to working with.
A balance figure is a result of something that’s
“left over” after you add or subtract from it.
We’re not adding or subtracting.
A running average figure is not showing you what’s left over, but in fact takes into consideration ALL monthly figures as they accumulate over time and is finding the middle or center figure. In practice it means a higher figure over your budget one month, is compensated for in the calculation by a lesser figure the following month.
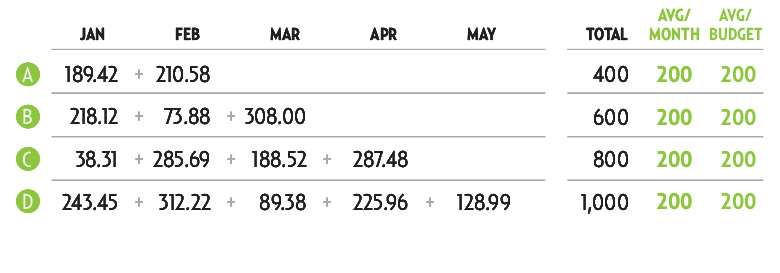
This fact alone changes the dynamics of financial control from a strict, month-by-month succeed/fail scenario, to a more forgiving scenario with figures that take more data into consideration that allow your financial life to breath while still having total control ~ because you have insight, demonstrated in the table above.
This is when things really begin to speed up.
4. Insight ~ Recognizing the Forest

If you were using MoneySlinger to
help you manage your cashflow, you’d gain
profound insight into your finances and could
easily spot your forest through the trees.
You could see, that regardless of what each individual item’s average figure might be, your TOTAL AVERAGE EXPENSE for all 4 of these items is actually $800/month. That $800/month figure is your forest. What can you do with this figure? A whole lot.
But first, there’s more insight to draw from this table.
If you look at the missing expense figures above in MARCH, APRIL and MAY for instance; even before you have each month’s bills in hand, you already know what their expense will be ~ and for the rest of the year. Yes, $200/month ~ on average.
But what if, after a few more months more of ACTUAL data, the average per month figure for expense item A increases to say $202/month? Well, for starters you would know it. If you’re using traditional money management practices, you’d never now it by just looking at say, the raw data in row D or the Total column. All you would know is your over one month, and under the next.
And so, while MoneySlinger is a very forgiving cashflow management program regarding expense variability, it’s also extremely precise, where you’ll know if you’re running under or over your budget, not just one month or the next, but to the nearest $1 per month at any point ~ through the entire year! That’s to say within $12 a year.
But let’s get back to our $800 forest.
Now that we have this NEW INSIGHT to see the larger picture, we can see further ahead, and with that new perspective now comes a NEW SENSE of control.
And so, it’s time to reconsider everything.
Instead of managing all these different expense items and variable figures individually, and at variable times of the month, one has to wonder if one can manage one’s financial life just as perfectly if one could simply manage that one, single forest of $800. Yes, one has to wonder.
The question to ask yourself is, how
much time, energy and mathematical calculation
could you be saving each month ~ all year long,
if you could simply pay all your individual,
mathematically detailed, highly variable expenses,
that are all due at different times of the month
ALL AT ONE TIME with a SINGLE PAYMENT of $800?
The answer is a whole lot of time and energy.
MoneySlinger changes everything.
No. It REALLY changes everything.
Summary
Averaging is the mathematical antithesis that directly addresses variability. It’s not a trick or an accident…it’s mathematical science and used in business and industry to analyze complex data, find trends, etc..
Averaging gives you the insight to “see the forest through the trees” with profound simplicity and clarity. This insight provides you with an opportunity to get yourself in FRONT of random financial disorder ~ before it even reaches you, and is where we’re going next.
